Test the brightness of the film and television lighting data reflected
(1 Photometric data photographic test method
Photometric data The development of the photographic test method is based on the cultural industry standard WH / T 26-2007 "stage lighting photometric test and labeling", can test the standard of all the luminosity parameters. The following parameters and curves can be tested:
(1) spot angle (θ): the diameter of the circular effective light spot at both ends and the center of the mouth connected to the formation of the angle. Note: all the hard spot for the effective spot. Soft (soft) light spot in the illumination value of not less than the maximum illumination value of 10% of the range of effective light spot. (2) Beam angle (θ1 / 2): the angle between the diameter of the circular half-peak spot and the center of the exit port. Note: The illuminance value of the spot is not less than 50% of the maximum illumination value. (3) Effective luminous flux (Fe): Total luminous flux in the range of effective light spot. (4) Average illuminance value (Ea): The average of the illuminance of the effective spot. (5) illumination uniformity (ξ): effective light spot within the average illuminance value and the maximum value of the ratio of illumination. (6) Lamp efficiency (ηl): The ratio of the effective luminous flux of the lamp to the total luminous flux of the light source used. (Ηe): the effective luminous flux of the lamp and the ratio of the total electric power consumed by all the electrical accessories necessary to ensure the normal operation of the light source.
8) Light spot distance coefficient (K): the diameter of the circular effective spot and the ratio of the distance. (9) and other illumination curve: a series of different illumination values of the same degree of illumination curve drawn together (see Figure 1). Fig.1 Curve of intensity curve (10) Light intensity distribution curve: The graph of light intensity with direction change (see Fig. 2). Note: light intensity distribution curve, also known as light distribution curve, in the civilian lighting industry is usually used in polar form. As the stage of professional lamps and civilian lamps are different, most of the condenser light, the light spot angle is small, only in the Cartesian coordinate system to better performance of its light distribution characteristics.
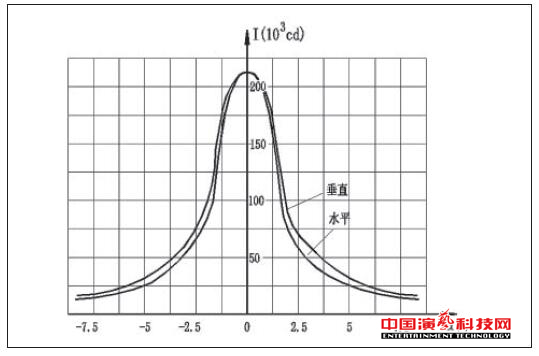 图(11) Distance, spot diameter and illumination relationship diagram: the circular spot center illumination or the average illumination and the effective spot diameter with the distance of the relationship between the changes (Figure 3).
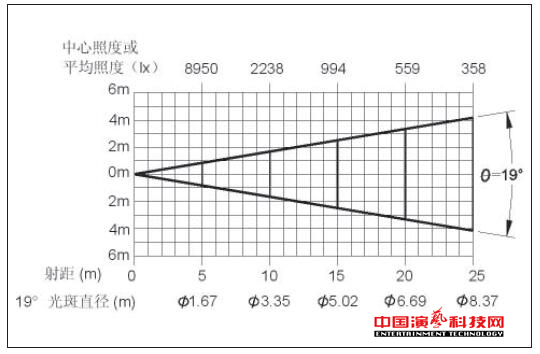 In addition, the photographic test method can also get the central illumination of the spot, the highest illumination in the spot and the position of the highest illumination deviation from the center of the spot. 2 photometric data test method and its basic principles of the lamp to adjust the normal working state, in the dark room will be projected into the diffuse reflection of the beam surface (usually can be flat matte wall), adjust the projection distance, in the (See Figure 4-1), the camera is under the control of the computer, and the camera is under the control of the computer (see Figure 4-1). 4-2) 1 and the illumination comparison of the photo (see Figure 4-3) 5, input distance, power and other raw data, you can complete the analysis in the computer operation, generate the above photometric test report (see Figure5)。
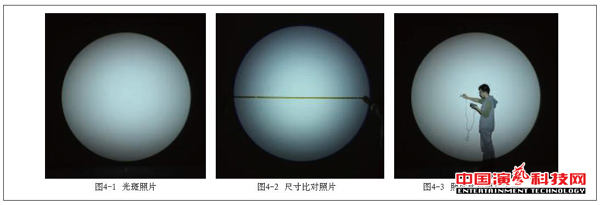
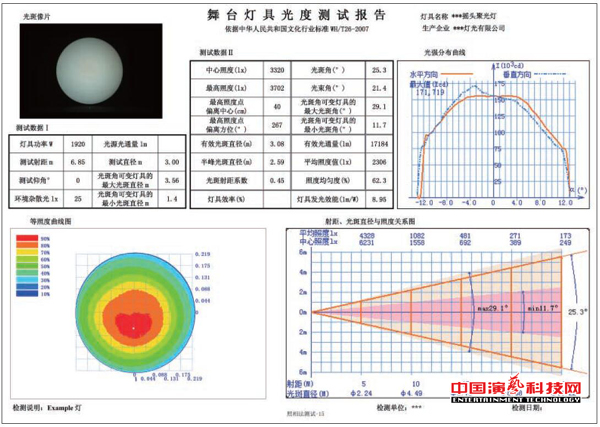 Figure 5 Stage Lighting Photometric Test Report Photometric Data The photographic test method uses a computer to analyze the digital photographs of the spot, convert the gray value of the lamp spot image into the corresponding illuminance value, and form a series of photometric data with a graph Test method. Among them, the size of the photo is the computer to collect the physical size of the process of the spot; illumination than the photo is used to collect the actual illumination and the camera photo gray scale between the corresponding function relationship. 5 photos of the illumination comparison photo should be included in the highest illumination and the lowest illumination point near the collection of data, the other three illumination contrast photos should be in the highest illumination and minimum illumination between the points (ie 3/4, 1/2 and 1/4) near the collection. Accordingly, the computer program to establish the corresponding fitting curve, to provide gray and illumination conversion when the corresponding basis. On this basis, the computer on the spotlight point by point scanning and translation of the illumination value, to obtain the illumination of the illumination data set. And then the light value of each point multiplied by the micro-area of the point that is the point of the micro-luminous flux, the effective spot within the point of the total luminous flux of the spot is the effective luminous flux. The calculation of the last step of the luminous flux is exactly the same as the distribution photometer or the manual test. 3 photometric data photographic test method Key photometric data photogrammetry is a new test technology, in the development of the need to solve many technical difficulties, the main technical difficulties include the following. 3.1 The relationship between the gray level of the photo and the actual illumination of the different light spot brightness difference between the brightness of the digital camera in the sampling time when the aperture size, shutter speed, sensitivity and other options changes, have a direct impact on digital imaging results ; And the characteristics of the digital camera itself is not linear, but the semiconductor device inherent S-shaped curve. Through a lot of data testing and research, finally find and determine their mutual correspondence, the establishment of a specific function of the fitting curve, to solve the photo gray and the relationship between the non-linear relationship between illumination. 3.2 massive data operation speed Spot photos of the pixels up to millions, or even tens of millions, by deburring, softening and other processing, and finally used to calculate the luminous flux data points are nearly 850,000, massive data calculation, the computer Computing speed is a great test. If you use the original calculation method, in the ordinary home or business notebook computer operation, will take tens of minutes, which will seriously affect the use and promotion of software. After repeated algorithm analysis, the algorithm is optimized, which greatly improves the operation speed and compresses the operation time to less than 1 minute, which creates a good foundation for the use and popularization of test method. 3.3 Spot image deformation problem In order to make the light distribution within the spot as close as possible on the stage of the actual application of the situation, "stage lighting test and labeling" standard requirements, the general lamp test spot diameter of 3 m. For such a large spot, the camera lens is usually in the wide, wide-angle state, deformation is difficult to avoid. In order to minimize the impact of deformation on the test, the viewfinder as far as possible so that the image of the spot in the center of the frame, surrounded by a certain space, so that can greatly reduce the degree of deformation of the image. Although the effective pixel of the spot is reduced, the pixel of the camera is very high, even if the spot area accounts for 1/3 of the total image area, there are millions of pixels in magnitude, and the calculation of the luminous flux does not need to be so Many of the calculation points, in fact, spot photos after processing, used to calculate the unit nearly 850,000. In addition to the camera when the camera position as close as possible to the lamp out to reduce the image distortion. 3.4 diffuse reflection surface of the diffuse reflector in order to make the imaging of the camera in the camera as much as possible to truly reflect the actual situation of the spot, the light cast light reflection surface must have the ideal diffuse reflection characteristics, the diffuse surface should be theoretically when the light When the reflection characteristics in different directions are uniform. But in the actual test, it is impossible to achieve such a high demand, otherwise the photographic test method is difficult to practical application and promotion. After the study, and in the software to take appropriate measures, in a smooth, slightly treated wall coated with matt paint, can be used as a reflection of the use of the camera. In such a wall to shoot out photos will inevitably produce some light point of change, which requires the image processing to be identified and processed to eliminate interference. In the software system using a number of special calculation and processing, both to ensure the accuracy of the test, but also reduces the photographic test surface requirements. Excerpt from "Performing Arts" 2016 No. 3 Liu Desan, Yu Shixiong "stage film and television lighting photometric data test method"